
What factors determine our height? The answer is in this article, which is the result of multiple studies around the world. The authors of this analysis are researchers Max Roser, Cameron Appel, and Hannah Ritchie. Their work is remarkable.
All the content of this article comes from the page “Human Height” from the site ourworldindata.org.updated 2024. The OWID graphics are based on the database NCD-RisC covering cohorts born between 1896 and 1996; unless otherwise noted, the averages cited therefore refer to the year of birth(e.g., “born in 1996”), not to measurements “today” (seePubMed publication).
After reading this article, you will understand why some men are tall and others are not. You will also learn what to do so your children grow normally. Happy reading!
Men’s height is determined by a combination of genetics and environmental factors. Recent scientific breakthroughs have made it possible to identify 12,000 genetic variants that may influence an individual’s height. Although genetics plays an important role in the future height of individuals in a population, many other factors play a decisive role, such as childhood malnutrition or disease. Recent large meta-analyses identify > 12,000 common variants associated with height; taken together, they explain ≈ 40% of the variance in people of European ancestry (less in other ancestries) (see Nature publication).
Men’s Height in the World
How does men’s height vary around the world?
In addition to genetics, other criteria impact the slowing of growth:
- Nutrition
- Health
- Environmental factors during pregnancy, childhood, or adolescence
We will discover detailed statistics on men’s height over the period 1896-1996.
What is the average height of men in the world?
The average height of males on Earth in 1996 was 5 ft 7 in (171 cm). There is great variation in height between peoples. On one side, the short inhabitants of Timor at 5 ft 3 in (160 cm), and on the other, the Dutch at 5 ft 11¾ in (182 cm). That represents a difference of about 8¾ in (22 cm).
Netherlands is the country with the tallest men in the world
Average height of men by date of birth
What is the average height of women around the world?
On average, women are 12 cm shorter than men worldwide. The average height of women born in 1996 is 159 cm, or about 5 feet 3 inches. The country with the lowest average height is Guatemala at 149 cm, while the tallest is Latvia at 169 cm, which is a difference of 20 cm, or about 7.9 inches.
As with men, women’s heights vary by region: women from Europe and Central Asia are the tallest on average at 164 cm, or about 5 feet 5 inches, while women from South Asia average 153 cm, or about 5 feet 0 inches.
Average height of women by date of birth
Gender height difference.
What is the average height gap between men and women?
On average, men are taller than women. Let’s see how far that pattern goes around the world.
Globally, the gap between the two sexes is about 12 centimeters, or roughly 4.7 inches. Recent statistics put average height at 171 cm, or about 5 feet 7 inches, for men and 159 cm, or about 5 feet 3 inches, for women.
Interestingly, this height difference between the sexes exists everywhere in the world. The largest gap is found in Macedonia, where men are on average 18.5 cm, or about 7.3 inches, taller than women. In Gambia, by contrast, the difference is only 4.5 cm, or about 1.8 inches.
Average height gap between the sexes over time
The graph below illustrates the difference in size between genders by region and over the years. This demonstrates that the size difference is proven in all countries of the world.
Average adult height by year of birth, male versus female
Where are men the tallest relative to women?
The following map shows the ratio of the average height of men and women worldwide. Globally, the ratio of average male to female height is 1.07, which means that men are, on average, 7% taller than women.
Interestingly, this global ratio of 1.07 has remained constant over the decades since 1896, despite the respective growth of both men and women. Some countries have seen shifting gaps, however. A century ago, South Korean men were about 7 inches (18 cm) taller than their female counterparts. By 1996, that difference had dropped to about 5 inches (13 cm). In stark contrast, the Philippines went from a gap of about 2.8 inches (7 cm) to about 5.5 inches (14 cm).
Ratio of height difference between men and women by year of birth
How do growth trends differ between boys and girls?
As we’ve outlined, the average height of men is greater than that of women everywhere in the world. But at what point during development does this difference emerge?
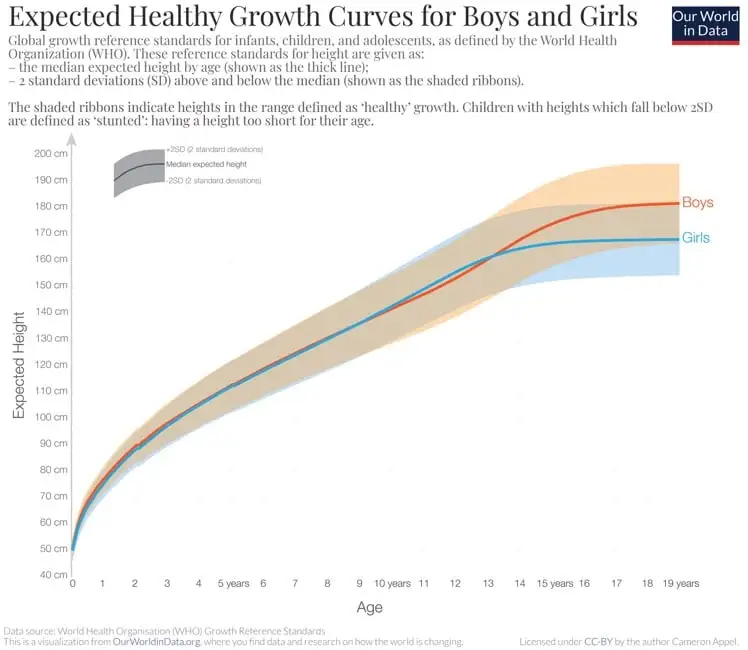
Boys are slightly taller than girls at birth. Both sexes grow rapidly during the first two months of life, then the rate of growth decelerates in the following years. After three years, boys and girls have approximately doubled their height since birth, but boys remain slightly taller.
Around age eight, boys’ growth slows, but not girls’. By age nine, girls often surpass boys.
At age eleven, girls average about 0.8 inches (2 cm) taller than boys of the same age. This is generally when girls’ growth starts to slow down. Boys then begin growing faster, and around age thirteen, boys pull ahead again.
Girls’ growth stops earlier than boys’ at around age sixteen on average, compared to eighteen for boys. By that point, men average about 5 inches (13 cm) taller than women.
Obviously, these figures don’t apply to everyone, but they represent global averages.
The first 1,000 days (pregnancy + ages 0–2) are critical: preventing stunted growth through adequate nutrition, clean water/sanitation, and proper care durably improves future height and health (source: World Health Organization publication).
The expected average height for a healthy population is about 5’4″ (163 cm) for women and 5’9.5″ (176.5 cm) for men.
Human Height Over Time
A century of height: how has adult height changed over time?
People today are taller than their ancestors from a century ago. This is true for every country in the world. But how many inches have men gained, and what variations have been observed globally?
Comparing adult men born in 1996 with those born a century earlier, average height rose from about 5’4″ (162 cm) to 5’7″ (171 cm). For women, it went from roughly 4’11” (151 cm) to 5’3″ (159 cm).
The average adult today stands about 3–3.5 inches (8–9 cm) taller than their ancestors did 100 years ago, roughly 5% taller.
Average adult height per year of birth worldwide
Regional variations and height changes
There are significant regional differences in how average height has evolved.
The greatest height gains go to Europeans and Central Asians, who gained about 4.3 inches (11 cm), surpassing North Americans. The smallest absolute gain belongs to South Asians, who grew by only about 2 inches (5 cm) over a century.
Overall, all regions saw an increase. For men born in 1896, the gap between the shortest and tallest populations was about 3.1 inches (8 cm); a century later, it widened to about 4.7 inches (12 cm).
For women, the trend is similar: European and Central Asian women’s heights grew the most, gaining about 4.3 inches (11 cm). Among women born in 1896, the gap between the shortest and tallest regions was about 3.5–4 inches (9–10 cm), and it remained roughly the same a century later.
Evolution of the average height of men in 100 years
Which country had the greatest absolute height gain?
Some countries have experienced much greater average height increases than others. The biggest winner is South Korea, with a gain of nearly 8 inches (20 cm). By comparison, Madagascar saw only about 0.6 inches (1.5 cm) of increase.
Growth in the average height of women born in 1996 versus 1896
Did heights increase more for men or for women?
It depends on the country. Globally, the increase was the same over the years: about 5%. But there is significant variation by country. Some countries have seen very different outcomes by sex. In South Korea, for example, women’s average height increased by 14% compared to 9% for men. In the Philippines, it’s the opposite, men grew 5% while women grew only 1%.
Average growth in percent between men and women in a century
Height growth over the last two centuries
Over the past two centuries, height has increased considerably across the world on average, reflecting a clear improvement in health and nutrition during that period.
Average height of men by year of birth
Height among early Europeans
Historical bone analyses show the evolution of male and female height in the eastern Mediterranean region from the Upper Paleolithic era (around 16,000 BC) to today.
Size of Men over the centuries in Europe
Height over the last two millennia
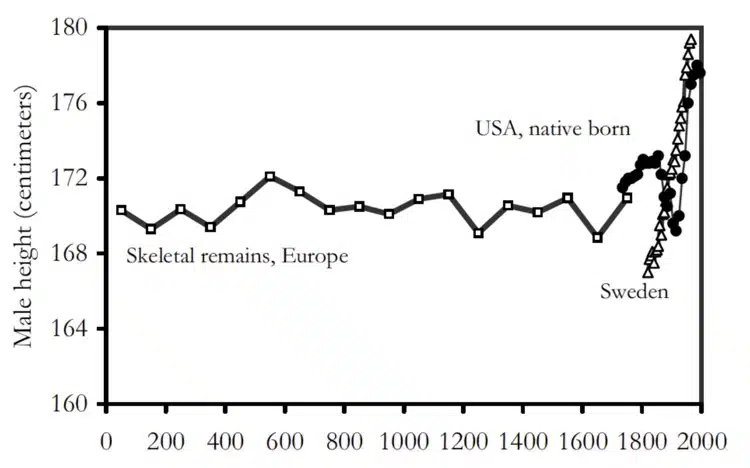
Over the past two millennia, based on bone analyses, male height has remained fairly stable at around 5’7″ (170 cm). With the arrival of modernity, we see a massive upward shift in heights in developed countries. It should be noted that using skeletal remains is subject to measurement errors regarding both height and estimated time period.
Size of male skeletons in Europe 1-2000 – Clark
Mesolithic era, middle ages, subsistence society and hunter-gatherer
Although average height has generally increased worldwide, this hasn’t been universal. The first table below shows heights during the hunter-gatherer and subsistence society eras. The figures show lower heights than in the pre-modern period, suggesting the impact of diet on growth during those times.
Average skeletal height in the hunter-gatherer and subsistence society era:
| Year | Group | Location | Ages | Height |
| 1892 | Plains Indians | United States | 23–49 | 5’8″ (172 cm) |
| 1970s | Anbarra | Australia | Adults | 5’8″ (172 cm)* |
| 1970s | Rembarranga | Australia | Adults | 5’7″ (171 cm)* |
| 1910 | Alaskan Inuit | United States | Adults | 5’7″ (170 cm)* |
| 1890 | Northern Pacific Indians | United States | Adults | 5’6″ (167 cm)* |
| 1944 | Sandawe | Tanzania | Adults | 5’6″ (167 cm)* |
| 1891 | Shoshone | United States | 20–59 | 5’5″ (166 cm) |
| 1970s | Fox Basin Inuit | Canada | Adults | 5’5″ (166 cm)* |
| 1880s | Solomon Islanders | Solomon Islands | Adults | 5’5″ (165 cm)* |
| 1906 | Canadian Inuit | Canada | Adults | 5’5″ (164 cm)* |
| 1969 | !Kung | Botswana | 21–40 | 5’4″ (163 cm) |
| 1980s | Aché | Paraguay | Adults | 5’4″ (163 cm)* |
| 1970s | Hadza | Tanzania | Adults | 5’4″ (163 cm)* |
| 1985 | Hiwi | Venezuela | Adults | 5’1″ (156 cm)* |
| 1980s | Batak | Philippines | Adults | 5’1″ (155 cm)* |
| 1980s | Agta | Philippines | Adults | 5’1″ (155 cm)* |
| 1980s | Aka | Central African Republic | Adults | 5’1″ (155 cm)* |
Average skeletal heights from the mesolithic era to today:
| Period | Location | Observations | Height |
| Mesolithic (a) | Europe | 82 | 5’6″ (168 cm) |
| Neolithic (a,b) | Europe | 190 | 5’6″ (167 cm) |
| Denmark | 103 | 5’8″ (173 cm) | |
| 1600–1800 (c) | Netherlands | 143 | 5’6″ (167 cm) |
| 1700–1800 (c) | Norway | 1956 | 5’5″ (165 cm) |
| 1700–1850 (c) | London | 211 | 5’7″ (170 cm) |
| Pre-Dynastic (d) | Egypt | 60 | 5’5″ (165 cm) |
| Dynastic (d) | Egypt | 126 | 5’5″ (166 cm) |
| 2500 BC (e) | Turkey | 72 | 5’5″ (166 cm) |
| 1700 BC (f) | Lerna, Greece | 42 | 5’5″ (166 cm) |
| 2000–1000 BC (g) | Harappa, India | — | 5’7″ (169 cm) |
| 300 BC–250 AD (h) | Japan (Yayoi) | 151 | 5’3″ (161 cm) |
| 1200–1600 (h) | Japan (Medieval) | 20 | 5’3″ (159 cm) |
| 1603–1867 (h) | Japan (Edo) | 36 | 5’2″ (158 cm) |
| 1450 (i) | Marianas, Taumako | 70 | 5’9″ (174 cm) |
| 1650 (i) | Easter Island | 14 | 5’8″ (173 cm) |
| 1500–1750 (i) | New Zealand | 124 | 5’9″ (174 cm) |
| 1400–1800 (i) | Hawaii | — | 5’8″ (173 cm) |
The Effects of Immigration on Height Differences
In a landmark 1939 study on Japanese immigrants in Hawaii, Harry Shapiro demonstrated a significant difference between the height of Japanese people born in Hawaii and Japanese immigrants born in Japan. Shapiro concluded that environmental factors played a crucial role in the growth of Hawaii-born individuals. Another study conducted by Marcus Goldstein on a population of Mexican immigrants to the USA reached the same conclusion.
Is height growth stalling?
Human height has increased over the past two centuries. It is true for every country in the world. But for the past 20 years, growth has stalled in some countries. The OWID series show a slowdown or plateau in Europe & Central Asia, and outright declines in the Middle East & North Africa, East Asia & Pacific, and Sub-Saharan Africa.
Several key points stand out. First, height changes around the world are gradual: average height never jumps suddenly but instead evolves by about 1% per year. Second, average height has grown significantly across regions over the past century. But trends also suggest this growth has stalled in Europe and Central Asia, and even reversed in the Middle East, North Africa, East Asia & Pacific, and Sub-Saharan Africa. The same is true for women, and average female height has also stalled in North America.
This seems like an unexpected result: height is positively correlated with living standards, which have grown over the decades, so why would average height stagnate or even decline? Two explanations recur in the literature: a biological ceiling when nutrition and health are already near optimal, and lifestyle changes (diet quality, sedentary behavior/obesity) that may hinder growth despite higher incomes.
This trend is particularly puzzling in Sub-Saharan Africa, where average height has seen the most significant decline even as the region has made notable progress in well-being and health.
In the next section we will see why it might be the case.
Annual change in average male height
Annual change in average female height
Why has height growth stalled in wealthy countries?
Height is partly determined by genes. Evolution aside, the gene pool of a population is fixed. It’s therefore reasonable to think that there is an upper limit to average height once nutrition and health factors are optimal. This scenario may explain the recent stagnation, especially in high-income countries where living standards are already high.
A study published in the scientific journal Nature examined the recent stagnation in height among the Dutch, the world’s tallest population. After 150 years of increases, average height slowed and then plateaued over recent decades. The researchers concluded that the main reason for this was not entirely clear. They suggest the Dutch may have reached the maximum achievable average height for a population. But they also hypothesized that recent lifestyle changes may have contributed to this slowdown, for example, easy access to fast food leading to weight gain. Additionally, the Dutch population’s historically high milk consumption, which had been linked to their above-average height, has fallen in recent years: from about 16.6 gallons (63 liters) per person per year in 2000 to about 15.8 gallons (60 liters) in 2010. Ultimately, the positive height trend in high-income countries could resume if these lifestyle factors improve.
Will growth resume in the future?
Improvements in environmental factors like nutrition and health could contribute to future height increases. However, the factors influencing height appear to be nearing their limits. Countries where living standards haven’t yet fully developed still have room to grow. But for the wealthiest countries, average heights are unlikely to increase much further.
What explains height differences?
There are large height differences around the world, and not just geographic ones. Human height has changed significantly throughout history, with gains in all countries over the past century. Important note: height is correlated with living standards but is not a direct or sufficient measure of well-being; it should be read alongside other indicators (health, education, etc.).
Height is determined by a combination of genetic and environmental factors. How our height reflects our environment, past and present, has been a major focus of research. Height is often seen as an indicator of biological standard of living: the World Health Organization describes it as a key marker for “predicting health, performance, and survival.” A study conducted across 105 different countries found that height and the Human Development Index (HDI) are largely interchangeable as indicators of good health. This is perfectly illustrated by the relationship between a country’s HDI and average male height by birth year. Higher height is observed in countries with better living standards.
Why is the relationship between the size of individuals and the socio-economic development of countries so strong?
Human Development Index versus Average Male Height, 1996
How does nutrition impact health?
Nutrition is one of the most powerful determinants of human height.
Humans convert the chemical energy stored in food into usable energy. The energy in food must balance the energy expended through metabolic functions, physical activity, and growth during childhood and adolescence. Nutritional deficiencies during development lead to a shorter adult height.
Protein is an essential macronutrient for a quality diet and is required for a wide range of biological processes, including growth. Proteins are made up of building blocks called amino acids. Some amino acids cannot be made by the body and must be consumed through diet. The diet must therefore provide a sufficient variety of amino acids for growth and proper metabolic function. The ability of different protein sources to meet these needs, based on amino acid profile and digestibility, is called “protein quality.”
Varied diets can cover essential amino acids; however, in low-income countries, limited dietary diversity remains a major barrier to reaching growth potential.
The table below shows protein quality scores for different foods. Animal sources generally provide higher-quality protein than plant sources. They are also good sources of iron and zinc, both necessary for metabolism. A diet including a large proportion of animal-based food is preferable for providing sufficient micronutrients and essential amino acids.
Protein Quality by Key Food Source:
| Protein Source | PDCAAS Score |
| Egg | 1 |
| Milk | 1 |
| Steak | 0.92 |
| Peas | 0.64 |
| Lentils | 0.63 |
| Black Beans | 0.53 |
| Peanuts | 0.52 |
| Chickpeas | 0.52 |
| Rice | 0.42 |
| Cereals | 0.42 |
A study by Headey (2018) on dietary patterns in developing countries found a strong association between consumption of animal-source foods and height. For example, animal proteins account for only 9.5% of energy intake in Madagascar, where the average male height is about 5’3.5″ (161.5 cm). Botswanans get about 12.5% of their calories from animal protein and are on average about 4 inches (10 cm) taller.
In high-income countries, where animal protein sources are plentiful, Grasgruber (2014) found that the strongest predictor of male height is the ratio between high-quality (animal) proteins (dairy, red meat, fish) and lower-quality plant proteins (cereals, rice, etc.). This explains why some countries with high socioeconomic status have lower-than-expected heights. It also explains the height difference between the Dutch and South Koreans: both have a high HDI (above 0.9), but the Dutch average nearly 3 extra inches (8 cm) (6’0″ / 182 cm vs. 5’9″ / 175 cm). What sets them apart is the animal protein ratio: 2.16 for the Dutch vs. only 0.69 for South Koreans.
A mix of plant-based protein sources, such as cereals combined with legumes or oilseeds, can provide the essential amino acids and micronutrients needed for good growth.
However, diets in developing countries are often dependent on a single food source. In Bangladesh, for example, over 75% of dietary energy comes from cereals and grains, 90% from rice alone.
By contrast, cereals and grains make up less than a quarter of dietary energy in the USA. As such, developing countries are often unable to diversify nutrition adequately.
Animal protein sources form an increasingly large part of our diets as incomes rise. Since nutrition plays a determining role in height, there is an obvious relationship between income and height. A high level of socioeconomic development therefore predicts higher average heights.
Total animal-form proteins vs. Average male body size, 1996
Does health affect height?
Health, particularly that of children, also influences human height. Illness during childhood can restrict growth due to reduced nutrient availability for metabolic needs. Children facing illness have greater nutritional requirements at a time when nutrients are less available. High rates of illness therefore lead to lower average heights.
Reducing infections and childhood mortality goes hand in hand with taller average heights, as confirmed by international comparisons from NCD-RisC (see pubmed publication).
Grasgruber (2016) found that the strongest socioeconomic factor correlated with male height was infant mortality. A low mortality rate suggests lower levels of illness, including childhood malnutrition, and therefore predicts a higher average height. For example, 0.2% of Finnish children die before age five, compared to 7.4% in Afghanistan; the average height of men in Finland is 5’11” (180 cm), compared to 5’5″ (165 cm) in Afghanistan.
The relationship between health and average height is reinforced by the significant impact of healthcare spending. We can see this reflected in Arab states where health spending is lower than their income level would suggest. Comparing Oman and the Netherlands, for instance: Dutch men average 6’0″ (182 cm), about 5 inches (13 cm) more than Oman. Both countries have a high income per capita. But the Dutch spend considerably more on healthcare: per-person spending in Oman is $1,442, or 3.7% of GDP, compared to $5,202, or 9.2% of GDP, in the Netherlands.
Mortality and healthcare spending impact life expectancy; we therefore expect them to be powerful determinants of the relationship between living standards and average height.
The total fertility rate (number of children per woman) also interacts with these determinants, making it the second-strongest correlation with height. The role of fertility in high-income countries is marginal since fertility rates are low. But it gains statistical significance in the lowest-income families, where fertility rates are relatively high. In families with a large number of children, spending and food available per child are lower. We can therefore expect that in countries with high fertility rates, healthcare spending and nutritional quality per child are low, while disease incidence is high.
Mortality rate vs Average size, 1996
To what extent do genes affect individual height?
Height differences are highly polygenic: they reflect the cumulative effect of thousands of small-effect variants rather than a few “haplogroup” markers. Current maps are best characterized for Europeans and remain less predictive in other ancestries (see Nature publication).
Height is partly determined by the interactions of different genes. A recent breakthrough in human genome sequencing has allowed researchers to identify 12,000 gene variations associated with height. These variations have a large number of combinations, which can lead to a wide range of potential heights.
Specific combinations of these variants are more common in certain populations than others, which may explain disparities in average height around the world. Certain haplogroups (groups of genetic variants inherited from a common ancestor) have shown associations with height.
For example, one haplogroup (J1-M267) is more commonly observed in populations spread across the Zagros Mountains of Iran to the Arabian Peninsula, particularly Yemen. Another haplogroup (R1b-S116) is often found in populations from Ireland, Great Britain, France, and Spain, likely descended from the Franco-Cantabrian region. These haplogroups are associated with shorter stature.
By contrast, haplogroup (I-M170) is more concentrated in Germanic Europe and the western Balkans, particularly in Herzegovina, regions characterized by above-average height, suggesting a strong correlation between haplogroups and height.
Is Height Determined by Nature or by Diet?
Is height determined by genes or by environment? The short answer depends on which countries you’re comparing. Height differences can be due to different genes, different environments, or, most commonly, a combination of both.
For example, the average height of men in Bosnia-Herzegovina is about 5’11” (181 cm), well above the global average of 5’7″ (171 cm) and the regional average of 5’10” (177 cm). This can’t be explained by high living standards or animal protein consumption: the HDI is one of the lowest in Europe, and the animal-to-plant protein ratio is only 0.33, compared to 2.16 for the Dutch. In this case, the cause must be genetic, nature over nurture.
The height differences between North and South Korea tell a different story, as explained by Pak (2005). Both halves of the Korean Peninsula share the same genetic lineage, but since the 1945 division, a large height gap has emerged. While average height in South Korea grew by about 1.5 inches (3.8 cm), one of the highest gains in the world, men in North Korea grew by only about 0.3 inches (0.8 cm). This disparity is more a reflection of differences in living standards: nurture over nature.
The equation that determines human height has many components. No single factor can predict the height of an individual or even a population. But broadly, average height can offer a unique glimpse into both the genetic makeup and the living standards of a population.
The distribution of adult heights
We’ve looked in detail at how much human height varies around the world. But this tells us little about how height is distributed globally, by region, or within a given country. How does height vary: do people tend to cluster around similar heights, or are there wide spreads?
At a large scale, heights are bell-shaped: in a large dataset, about two in three people fall within 3 inches (7–8 cm) of the average — ±3 inches (7.6 cm) for men and ±2.8 inches (7.1 cm) for women.
What does the distribution of heights look like?
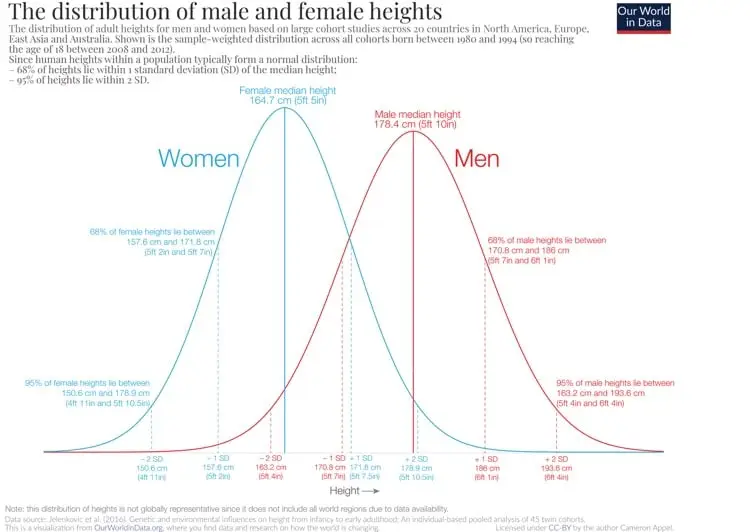
Adult heights within a given population are approximately normally distributed due to genetic and environmental factors. Height is partly determined by the interaction of 423 genes with 12,000 variants. One of the basic rules of probability (known as the central limit theorem) states that the distribution of a trait determined by random variables, like height and genes, roughly follows a bell curve. This means human heights within a population cluster around the average. In statistical terms, the mean and median height are the same, falling right at the middle of the distribution.
The normal distribution of heights allows us to draw conclusions about the range. About 68% of heights will fall within one standard deviation of the mean; 95% within two standard deviations; and 99.7% within three. If we know the standard deviation of height in a population, we have a solid understanding of how height varies across that population.
Based on height data from nearly 150,000 twins born between 1886 and 1994, one study investigated how height variance plays out across populations over a lifetime, and attempted to understand the differences between environmentally and genetically driven variation. Totaling the regions with available data, Europe, North America, Australia, and East Asia, average male height in the most recent cohort (born 1980–1994) was 5’10” (178.4 cm), with a standard deviation of 3 inches (7.59 cm). This means 68% of men fall between 5’7″ and 6’1″ (170.8–186 cm), and 95% between 5’4″ and 6’4″ (163.2–193.6 cm). Women are shorter on average, at 5’5″ (164.7 cm), with a standard deviation of 2.8 inches (7.07 cm). This means 68% of women fall between 5’2″ and 5’8″ (157.6–171.8 cm), and 95% between 4’11” and 5’10” (150.6–178.8 cm).
Regionally, the standard deviation in male height is largest in North America and Australia at about 3 inches (7.49 cm), and smallest in East Asia at about 2.5 inches (6.37 cm). The pattern is similar for women, with 2.7 inches (6.96 cm) in North America and Australia and 2.3 inches (5.74 cm) in East Asia. Part of the height distribution within a given population likely reflects the degree of genetic variance.
How much do living standards and environment influence height distribution?
Height differences within a given population are not solely influenced by genetic variance. Greater environmental variance within a population is reflected in a wider height distribution. The distribution of heights has historically been used as an indicator of socioeconomic inequality.
In a population with equal access to food and natural resources, height distribution should be marked only by genetic variability. Unequal access to resources within a population means that wealthier individuals may have better health and nutrition, and therefore tend to grow taller than poorer ones, widening the height variance. In other words, resource-driven variance from income inequality adds on top of genetic variance, broadening the height distribution. Some empirical evidence from various contexts supports this hypothesis.
In India in the 20th century, for example, a person’s caste had a significant influence on their height. Members of higher castes, who had better access to nutrition and healthcare, were about 1.8 inches (4.5 cm) taller than the average member of lower castes. It’s unlikely that genetic differences between caste groups explain this height difference, given the shared genetic heritage of the population.
Furthermore, Ayuda (2014) identified a relationship between socioeconomic status and height among Spanish conscripts from 1850 to 1958. They found that literate conscripts were consistently taller than illiterate ones (by nearly 0.4 inches / 1 cm), and that agricultural workers and laborers with limited financial resources were significantly shorter (-1.4 inches / -3.6 cm) than skilled or professional workers.
Height inequality, measured by the coefficient of variation (CV), is therefore positively correlated with income inequality as measured by the Gini coefficient.
This relationship was observed in a study of Kenya during the 20th century, where the CV mirrored fluctuations in the Gini coefficient. It also compared height distributions in Uganda and Togo, where average heights were roughly equal, but income inequality was greater in the former. Sure enough, height distribution was wider in Uganda.
Genetics or environment: which contributes more to height variation within a country?
So both genetic and environmental factors impact height variation. But which is the more important determinant? The relative contribution of genetic factors to height differences within a population is called “heritability.” Heritability is measured between 0 and 1; the higher the heritability, the greater the genetic contribution. Twin and adoption studies have estimated heritability at 0.8. This means the majority of height variation within a population is due to genetic variation, but environmental variation driven by socioeconomic factors also plays a role.
Data Quality and Definitions
Accurately measuring an individual’s height is a straightforward task, and we can be confident that there are few measurement errors in recording this data. The same cannot be said for measuring skeletal height. Furthermore, the techniques used to date skeletal remains (carbon-14 dating) can only offer probabilistic estimates.
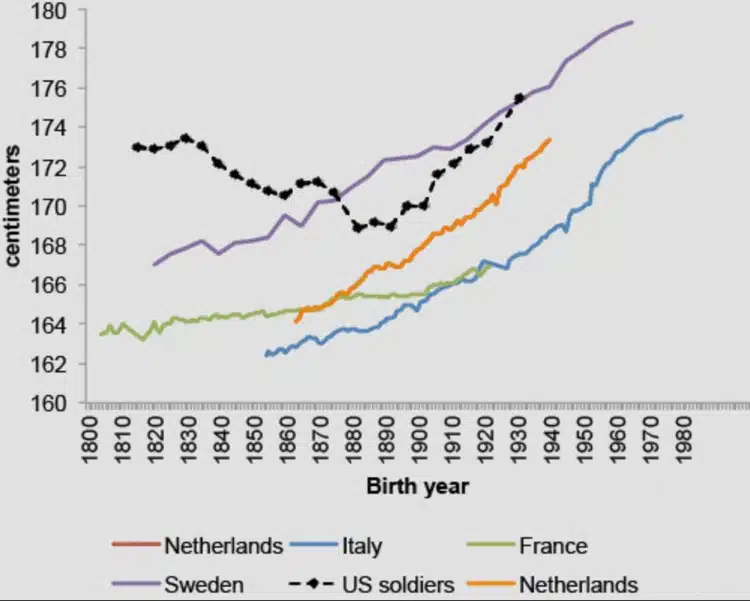
Other factors to consider include potential sampling bias in historical sources. Since data largely comes from soldiers, criminals, slaves, and servants, these groups were not necessarily representative of the full population. This issue has been highlighted by academic researchers in the field of human height. In fact, the height decline observed during the Industrial Revolution, generally attributed to the negative health impacts of industrialization, may be explained by labor market conditions of the time. They argue that “as economies grew, tight labor markets discouraged military enlistment among the most productive workers (who were therefore being measured), leaving a disproportionately disadvantaged segment of society.”
Comparing the heights of US Army volunteers with countries that had mandatory military service makes this bias clearer. In countries with conscription, the average height of enrollees increased during the period; meanwhile in the USA, where military service was voluntary, the height of soldiers declined.
Average heights of volunteer soldiers in the US and some countries with conscription – Vox
Another issue is that there is no systematic recording of women’s heights. Historical data on female height remains scarce.
Data Sources
Note: OWID/NCD-RisC comparisons are based on birth cohorts (1896–1996), which is why some figures for “tallest/shortest countries” refer to 1996 rather than the current year.
NCD Risk Factor Collaboration (NCD-RisC)
- Data: Male and female heights
- Geographical coverage: Global
- Time span: Adult heights for individuals born from 1896 to 1996
- Available at: NCD-RisC online here
Tübingen Height Data Hub
- Data: Many different datasets on human height
- Geographical coverage: Global
- Time span: Some data goes as far back as the 17th century
- Available at: University of Tübingen online here
- Authors: Jörg Baten, John Komlos, John Murray et al.
Clio Infra Project
- Data: Heights by birth decade and country (male height equivalent in cm)
- Geographical coverage: 165 countries
- Time span: 1810–1989
- Available at: Clio Infra online here
- Authors: Jörg Baten (University of Tübingen) and Mathias Blum (Technical University Munich)