
In this article we’re going to dig into the limits of ideal weight calculation methods when you’re on the taller side. We’ll then break down why these formulas fall short and wrap up with some eye-opening real-world examples from the animal kingdom. Enjoy!
1. Preamble
There are plenty of ways to calculate your ideal weight. In this article we’ll walk through the classic methods and explain why they break down for tall people. Then we’ll explore better ways to think about weight when you’re above average height.
A. Via formulas
These ideal weight formulas come with some serious blind spots. For example, a very muscular person would be flagged as obese under the following formulas or under BMI (Body Mass Index) and BFP (Body Fat Percentage) calculations.
The same goes for people at the extremes of the height spectrum. The further you stray from average height, the less relevant these formulas become; we’ll get into exactly why later in the article.
It’s also worth noting that a person’s physical wellbeing should never be reduced to a formula. How you feel in your day-to-day life matters a whole lot more.
B. Via tools
For anyone who wants a serious, accurate picture of their ideal weight, the best move is to look at body fat percentage. It’s the only concrete indicator for validating healthy weight loss. Nothing beats a visit to a specialized physician for that! They’ll use professional-grade tools to measure your fat percentage properly.
For those just looking for a ballpark, a bioelectrical impedance scale can do the job. It’ll spit out all kinds of stats, like body fat %, muscle %, water %, and more. That said, these scales aren’t super reliable and are particularly ill-suited for very muscular people.
The most effective affordable method, though, is the skinfold caliper. This is what doctors use: they pinch the skin at various points on the body to measure fat thickness, add up the totals, and give you your body fat percentage based on your age and sex. It’s the most bang-for-your-buck approach out there.
Now let’s take a look at the classic quick-calculation methods before diving deeper into why they fail for tall people.
2. The classic methods
These methods are all designed to calculate an ideal weight based on height. There are 3 classic formulas:
A. Broca formula
The simplest is the Broca formula. It consists of subtracting 100 from your height in centimeters:
Height (in centimeters) – 100 = ideal weight in kilos
For example, a person measuring 5 ft 11 in (180cm) will have an ideal weight of: 180-100=80kg, which is 176 lbs.
There is a margin of error of 15% for men and 10% for women.
Under this formula, a person of 6 ft 11 in should ideally weigh 220 lbs. Which is not too surprising, all things considered.
B. Lorentz’s Formula
The second fairly simple formula: the Lorentz formula, it is still more advanced than the previous one and is presented as follows:
Men:Height in centimeter – 100 – ((height in cm−150)/4)
For a man standing 6 ft 3 in (1m90):
190 – 100 – (( 190 – 150)/4) = 80kg or 176 lbs
For someone at 6 ft 11 in (210 cm):
210 – 100 – (( 210 – 150)/4) = 90 kg or 198 lbs
You can already start to see where this formula runs into trouble for taller people.
For women is as follows:
Women: Height in cm − 100 − ((height in cm−150)/2.5)
For a woman standing 5 ft 11 in (180 cm):
180 – 100 – (180-150)/2.5 = 68kg or 150 lbs
C. Creff’s Formula
The third and most sophisticated formula is the Creff Formula. Its distinguishing feature is that it factors in body type:
Height in centimeters – 100 +K x (9/100) x age
Where K represents body type:
- 0.9 for lean body types
- 1 for average body types
- 1.1 for large body types
This gives for a person at 6 ft 3 in (1m90) tall, 30 years old with an average build:
190 – 100 + 1x (9/100) x 30 = 92.7kg or 204 lbs, which is noticeably higher than the other formulas.
And for a person at 6 ft 11 in (2m10) tall of the same age, same build:
210 – 100 + 1x (9/100) x 30 = 112.7kg or 248 lbs
This one seems better suited to taller individuals than the others, and we’re about to see why.
D. Body Mass Index graphs
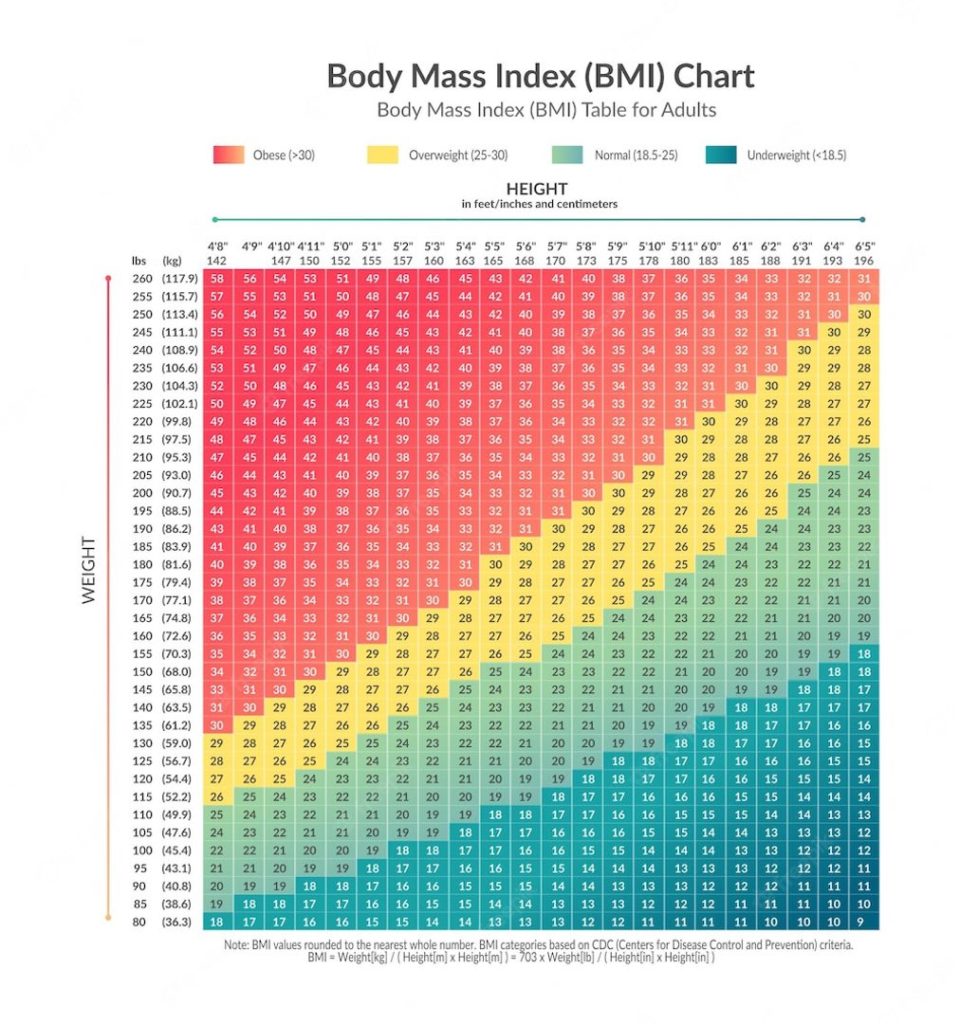
To wrap up this section, let’s look at the Body Mass Index charts commonly used by health professionals:
The classic BMI chart is quite representative of the aforementioned formulas if you have a normal build. However, as soon as you’re a bit bulky (stocky or muscular) you realize that for large sizes it becomes inadequate.
Here is another one related to the body mass index that is more complete (in English):
Finally, here is a personalized French version for tall people (click on the image to see better):
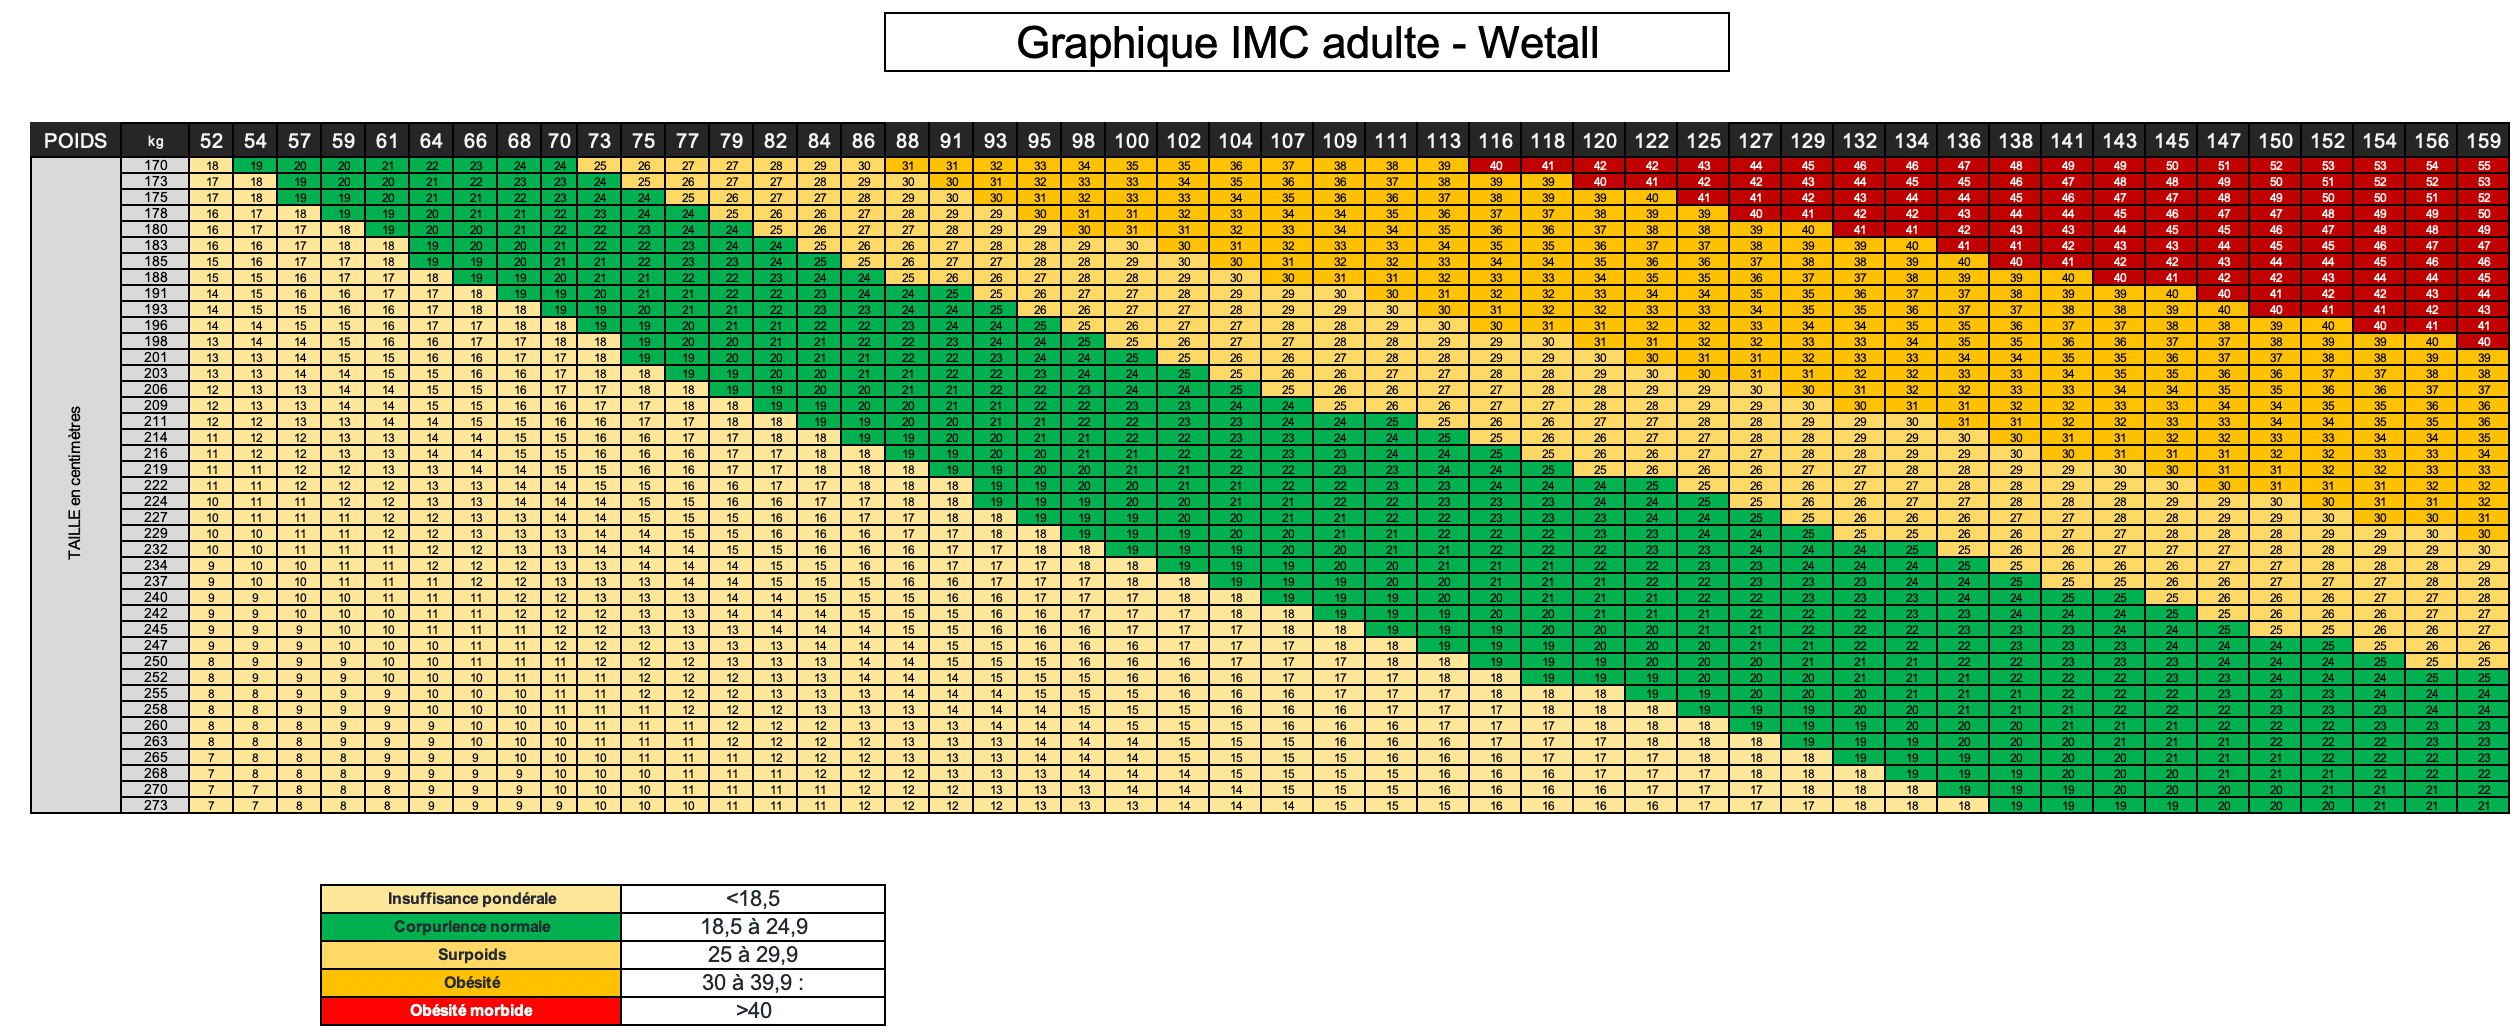 (Thanks to business-plan-excel.fr for the base matrix)
We can see in this chart that the taller you are, the less logical and the more complicated it seems to apply the Body Mass Index calculation formula, which is:
BMI = weight (kg) / (height (cm) x height (cm))
3. Why can tall people be proportionally heavier?
The reason tall people proportionally weigh more than people of average height comes down to one thing: the square-cube law.
A. What is the square-cube law?
This rule, also called the scaling effect, applies to all living things, as well as to all existing structures.
It states that the volume of an object grows proportionally faster than its size. For a cube: if you double the length of each side, the weight multiplies by eight.
In plain terms: volume in 3 dimensions is proportional to the cube of height, while surface area in 2 dimensions is only proportional to the square of height.
And that has a direct impact on weight.
If this is still not clear we invite you to watch this video:
B. How does the square-cube law apply to humans?
This logic applies perfectly to cube-shaped objects. Humans, of course, aren’t cubes; we’re closer to a rectangular prism or a cylinder.

If you run the numbers for a modest increase in chest circumference as height goes up, the mass gain turns out to be fairly linear, meaning the square-cube law only applies to a limited degree for most tall people.
Demonstration:
The table below uses standard chest measurements for normal builds: a XXL was assigned for someone at 6 ft 11 in(210 cm) with a chest circumference of about 47 in (120 cm), then extrapolated from there using the same logic applied to shorter heights.
Volume was calculated using cylindrical volume formulas (with the inherent limitations that come with that). Namely, calculating the area based on circumference and then multiplying by height: 𝜋 x (circumference/2𝜋)²
To convert cubic centimeters to pounds, the human body density of 66.3 lbs/ft³ (1,062 kg/m³) was applied.
The result is as follows:
| Height | Chest circumference | Model volume (cm³) | Weight |
|---|---|---|---|
| 5’3″ (160 cm) | 37.4 in (95 cm) | 718.55 | 149 lbs (67.7 kg) |
| 5’7″ (170 cm) | 39.4 in (100 cm) | 796.18 | 165 lbs (75.0 kg) |
| 5’11” (180 cm) | 41.3 in (105 cm) | 877.79 | 182 lbs (82.7 kg) |
| 6’3″ (190 cm) | 43.3 in (110 cm) | 963.38 | 200 lbs (90.7 kg) |
| 6’7″ (200 cm) | 45.3 in (115 cm) | 1052.95 | 219 lbs (99.2 kg) |
| 6’11” (210 cm) | 47.2 in (120 cm) | 1146.50 | 238 lbs (108.0 kg) |
| 7’3″ (220 cm) | 49.2 in (125 cm) | 1244.03 | 258 lbs (117.1 kg) |
| 7’7″ (230 cm) | 51.2 in (130 cm) | 1345.54 | 279 lbs (126.7 kg) |
| 7’10” (240 cm) | 53.1 in (135 cm) | 1451.04 | 301 lbs (136.6 kg) |
| 8’2″ (250 cm) | 55.1 in (140 cm) | 1560.51 | 324 lbs (146.9 kg) |
| 8’6″ (260 cm) | 57.1 in (145 cm) | 1673.96 | 347 lbs (157.6 kg) |
| 8’10” (270 cm) | 59.1 in (150 cm) | 1791.40 | 372 lbs (168.7 kg) |
The results show that the taller you get, the smaller the gap between height and “ideal” weight becomes.
C. How does the law apply to extremely people?
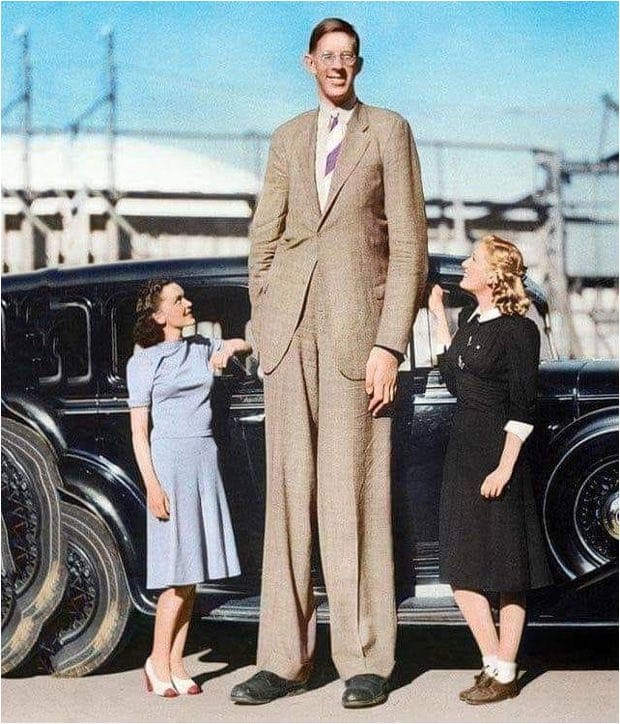
At extreme heights, however, the square-cube law kicks in hard. You can see this clearly with Robert Wadlow, the tallest human being in recorded history, who was never particularly heavy-set.

We can see that the logic of the square-cube law fully applies:
| Age | Height | Weight | BMI |
|---|---|---|---|
| 5 yrs | 5’5″ (164 cm) | 106 lbs (48 kg) | 17.85 |
| 8 yrs | 6’0″ (183 cm) | 170 lbs (77 kg) | 22.99 |
| 9 yrs | 6’5″ (195 cm) | 181 lbs (82 kg) | 21.56 |
| 10 yrs | 6’6″ (198 cm) | 209 lbs (95 kg) | 24.73 |
| 11 yrs | 6’7″ (200 cm) | 209 lbs (95 kg) | 23.75 |
| 12 yrs | 6’11” (210 cm) | 209 lbs (95 kg) | 21.54 |
| 13 yrs | 7’2″ (218 cm) | 256 lbs (116 kg) | 24.41 |
| 14 yrs | 7’5″ (226 cm) | 302 lbs (137 kg) | 26.82 |
| 15 yrs | 7’8″ (234 cm) | 355 lbs (161 kg) | 29.4 |
| 16 yrs | 7’10” (240 cm) | 375 lbs (170 kg) | 29.51 |
| 17 yrs | 8’0″ (245 cm) | 315 lbs (143 kg) | 23.82 |
| 18 yrs | 8’4″ (253 cm) | 315 lbs (143 kg) | 22.34 |
| 19 yrs | 8’6″ (258 cm) | 481 lbs (218 kg) | 32.75 |
| 20 yrs | 8’7″ (261 cm) | 481 lbs (218 kg) | 32 |
| 21 yrs | 8’8″ (265 cm) | 490 lbs (222.4 kg) | 31.67 |
| 22 yrs | 8’11” (272 cm) | 439 lbs (199 kg) | 26.9 |
Robert Wadlow weighed 441 lbs (200 kg) at a height of 8 ft 11 in (272 cm). The Broca formula would have suggested around 379 lbs (172 kg), yet as the photos clearly show, he was extremely slender.
We can see this even more clearly in this chart:
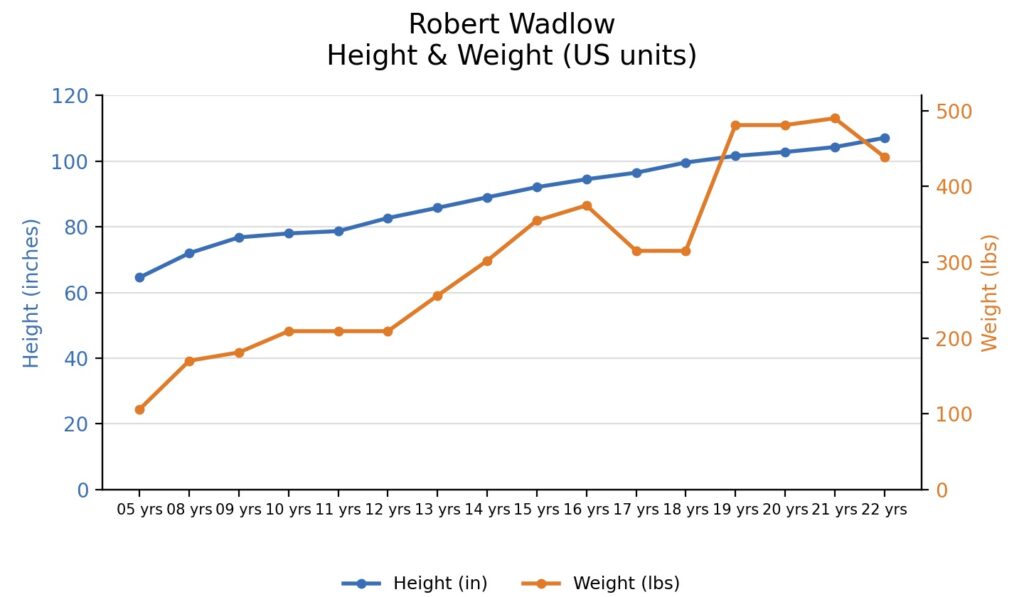
As he grew, the gap between height and weight decreased.
Another vivid example is that of former Chinese basketball player Yao Ming. He stood 7 ft 6 in (229 cm) and was never overweight, yet he weighed 311 lbs (141 kg), compared to the roughly 262 lbs (119 kg) some ideal weight formulas would have suggested. Here is a photo of the player:

We will continue in the next section with other illustrated examples to understand the implication of the square-cube law.
4. The proof in pictures
Let’s look at some real-world examples, both human and animal, to drive the square-cube law home.
A. Giant Strongman vs Crossfit Champion
First up, a fascinating comparison. In the image below, you’ll notice that Thor Björnsson (former World’s Strongest Man and Game of Thrones actor) and Mat Fraser (multiple CrossFit Games champion) have remarkably similar silhouettes:

The muscular and physical proportions of the two athletes seem (more or less) identical. One might therefore think they have the same height-to-weight ratio. But that is not the case.
Here are their respective measurements:
| Height | Weight | |
|---|---|---|
| Thor | 6’9″ (206 cm) | 322 lbs (146 kg) |
| Mat | 5’7″ (170 cm) | 194 lbs (88 kg) |
Here are their stats:
- Mat Fraser is +18 above what his height would suggest on a standard scale.
- Thor Björnsson is +40 above what his height would suggest.
Thor is 14 inches (36 cm) taller than Mat, and 128 lbs (58 kg) heavier!
This is the square-cube law in full effect. A tall person who gains weight at the same visual rate as someone of average height is actually gaining weight not linearly, but exponentially, because of the cube vs. square dynamic.
The real images:

Let’s now see if this logic applies in animals, which are living beings too, and have the particular feature of being much larger than humans and sometimes much heavier.
B. The square-cube law in bears
The square-cube law shows up just as clearly in the animal kingdom. Let’s look at different bear species, assuming similar density and body shape across species:
| Bear | Height | Weight | Difference |
|---|---|---|---|
| Panda | 5’11” (182 cm) | 225 lbs (102 kg) | +176 lbs (+80 kg) |
| Black bear | 6’11” (213 cm) | 399 lbs (181 kg) | +71 lbs (+32 kg) |
| Grizzly | 7’11” (243 cm) | 800 lbs (363 kg) | −265 lbs (−120 kg) |
| Polar | 10’11” (335 cm) | 1,301 lbs (590 kg) | −562 lbs (−255 kg) |
| Kodiak | 9’11” (304 cm) | 1,301 lbs (590 kg) | −631 lbs (−286 kg) |
The pattern holds perfectly. The larger the animal, the more pronounced the effect. Height increases linearly across species — but weight grows exponentially, as the chart clearly shows:
C. The square-cube law in sharks
Same exercise with sharks of similar body type:
| Shark | Length | Weight | Difference |
|---|---|---|---|
| Common thresher shark | 8’2″ (250 cm) | 192 lbs (87 kg) | +359 lbs (+163 kg) |
| Sand tiger shark | 10’6″ (320 cm) | 331 lbs (150 kg) | +375 lbs (+170 kg) |
| Great white shark | 19’8″ (600 cm) | 2,425 lbs (1,100 kg) | −1,102 lbs (−500 kg) |
| Whale shark | 55’9″ (1,700 cm) | 55,115 lbs (25,000 kg) | −51,368 lbs (−23,300 kg) |
Even with limited data points, the rule holds. There are likely additional factors to dig into, particularly the role of water in supporting extreme weight, which helps explain the sheer size some sharks can reach.
D. The square-cube law in felines
To conclude the animal section, let’s look at one final example with felines, still with similar body proportions:
| Feline | Length (without tail) | Weight | Difference |
|---|---|---|---|
| Cat | 9.8 in (25 cm) | 9 lbs (4 kg) | +46 lbs (+21 kg) |
| Panther | 5’3″ (160 cm) | 198 lbs (90 kg) | +154 lbs (+70 kg) |
| Jaguar | 5’11” (180 cm) | 212 lbs (96 kg) | +185 lbs (+84 kg) |
| Lion | 6’11” (210 cm) | 551 lbs (250 kg) | −88 lbs (−40 kg) |
| Siberian tiger | 9’6″ (290 cm) | 772 lbs (350 kg) | −132 lbs (−60 kg) |
This once again reinforces the idea that weight gain is not proportional to height, even when body shape stays the same.
Comparison of a Siberian tiger and a cat (two extremes from the previous table)


5. Conclusion
Calculating ideal weight isn’t always straightforward when you’re tall. While the classic formulas can work fine for average builds, they fall apart quickly once weight, whether fat or muscle, enters the picture.
We also now understand why these formulas go off the rails: it all comes back to the square-cube law, which causes surface area to grow with the square of height while volume and weight grows with the cube.
And we’ve seen through bears, sharks, and big cats that this law applies just as much to the animal world as it does to us.
We could have pushed further and tried to build a precise formula for tall people’s ideal weight, but that wasn’t the point of this article, and any such formula would have become too complex to be practical. The goal here was to help you understand the big-picture logic of the square-cube law as it applies to living things. A future article more focused on finding that ideal formula may be coming.
We hope you enjoyed this one! Remember, whatever you weigh, what matters most is feeling good in your own skin. No ideal weight formula will ever replace a good visit to your doctor!
A big thank you to Mickaël for the scientific review!